If you traded on Friday, there’s an eighty percent chance you got stopped out of at least one position.
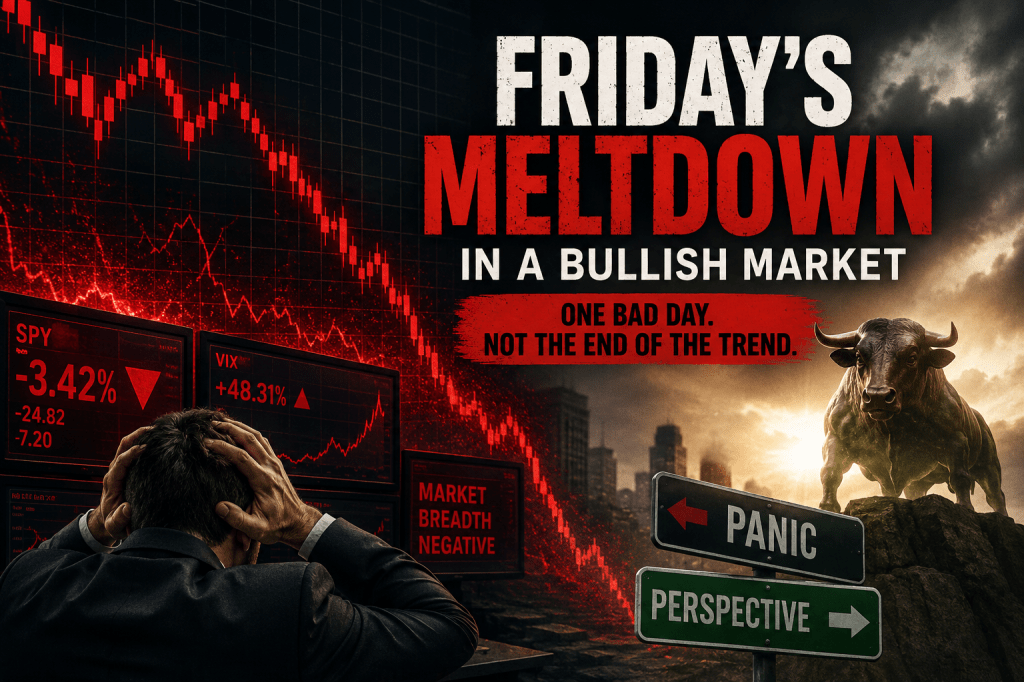
It is easy to get frustrated when a sea of red hits your portfolio, but getting stopped out during a sudden market flush is simply the tax you pay for riding a massive trend upward. The key is understanding why the market reacted the way it did, how we spotted the warning signs early, and how to navigate the choppy waters ahead without falling into the classic “first bounce trap.”
The Macro Catalyst: Good News is Bad News (Again)
On paper, Friday’s economic data was objectively good for the American consumer:
- Unemployment rate: Solid and stable.
- Job creation: Highly resilient.
Logically, a strong workforce means consumer spending power, which should support corporate earnings. But the market isn’t trading current logic; it is trading future inflation and the Federal Reserve.
We have been battling sticky inflation for years. Just as it seemed to be pulling back into the Fed’s target zone, recent data suggests it is heating up again.
[Strong Jobs Data] ➔ [Sticky Inflation Fears] ➔ [Higher-for-Longer Fed Policy] ➔ [Market Pullback]
A few months ago, the consensus was priced for at least one rate cut by the end of the year. Now, the market is rapidly pricing in zero rate cuts and whispers of a potential rate hike. When the market is sitting at historic, frothy, and highly extended levels, it doesn’t take a catastrophic event to trigger a liquidation event. It just takes an excuse. The jobs report was that excuse.
Technical Analysis: Spotting the Exhaustion Clues
We did not know the flush would happen exactly on Friday, but the market left distinct breadcrumbs earlier in the week. Those tracking market character closely saw several warning signs that it was time to lighten up exposure.
1. The Good News Discount
The most telling clue came from earnings reactions on Wednesday after hours and Thursday. High-flying market leaders like CrowdStrike (CRWD), Palo Alto Networks (PANW), and Broadcom (AVGO) all reported spectacular quarters. They beat on revenue, beat on earnings-per-share (EPS), and raised future guidance.
In a healthy bull market, those triple-play beats send stocks gapping higher. Instead, they gapped down and sold off. When extended stocks stop reacting positively to structurally fantastic news, it means the upside is completely priced in, and institutions are looking for an exit door.
2. Character Shift in Action
When analyzing price structure on a pullback, watch the relationship between local highs and lows. Even deep pullbacks can preserve a healthy, structural trend if they maintain a pattern of higher highs and higher lows.
A structural trend breakdown follows a specific sequence:
Normal Trend: [Higher High] ➔ [Deep Pullback] ➔ [Higher Low] (Healthy)Trend Warning: [Lower Low] ➔ [Reflex Bounce] ➔ [Lower High] (Danger)
If the current breakdown invalidates prior structural lows, the market’s character has shifted. Pay close attention to volume over the coming days: a minor uptick on a pullback is normal, but if heavy distribution volume begins averaging above the standard line alongside declining prices, the trend is broken.
The Sympathy Cycle: Tracking the Institutional Rotation
Friday’s price action was a textbook case of institutional capital rotation. The money did not completely flee the equities ecosystem into cash or safe-haven bonds; instead, it rotated out of over-leveraged, parabolic winners and into defensive, lagging sectors.
Market Map: Friday’s Winners & Losers
| De-Risking Sectors (Hard Hit) | Capital Inflow Sectors (Relative Strength) |
| • Semis & Computer Systems (AI Data Centers) • Software & Communications • Industrial Metals (Copper down 10%, Silver, Aluminum) • Energy (Oil & Gas infrastructure) | • Housing & Residential Construction • Financials & Banking • Healthcare • Consumer Staples (Grocery, Food Distribution, Restaurants) |
This rotation is a healthy sign for the long-term health of the broader market. It indicates that large funds are rebalancing rather than panicking.
This behavior aligns perfectly with the standard Sympathy Cycle seen in parabolic bull runs:
- The Core Leaders: Tier-1 names (the Nvidias of the world) break out on real, fundamental shifts.
- The Mid-Tier Runners: As leaders become too expensive, capital flows to second-line providers to capture remaining value.
- The Junk Phase: Capital moves into low-quality, speculative “sympathy” plays that lack earnings but share the sector acronym. This is typically the sign of a localized top.
Game Plan: How to Trade Next Week
We are in the business of analysis, not prediction. We do not need to guess whether the market will find immediate support or flush deeper; we simply need to wait for the data to confirm the next move.
Trading Rule: Beware the first bounce trap.
When a market experiences a sharp, high-volume drop, the first green day or morning pop is rarely a true reversal. It is often a reflex bounce—a “dead cat bounce”—that traps aggressive retail buyers before making a lower low.
- Exercise Patience: Let the market stabilize and form a valid base or tight consolidation range before adding heavy long exposure.
- Size Down Your Risk: You can absolutely still trade, but cut your standard position sizing in half (e.g., if you normally trade 500 shares, drop to 250). Reduce your trading frequency.
- Track Sector Breadth: Utilize custom ETF lists or Morningstar industry indexes to monitor daily, 5-day, and 30-day performance. Look closely to see if money continues to stick to the defensive rotation spaces, or if tech leaders swiftly reclaim their moving averages.
Keep your risk tight, protect the capital you made on the way up, and let the price action prove itself before stepping back on the gas.
Want more insights on trading?
For more on swing trading check out my swing service at bullsonwallstreet.com and 7 Day Trial
Follow me on twitter and instagram.
Information on Personal Mentoring.
Author Bio
Paul J Singh is a 20+ year trader, Bullonwallstreet.com Swing Trading Coach, and swing trading mentor. He teaches traders how to combine technical analysis, options, risk management, and performance psychology into a repeatable edge.

Leave a comment