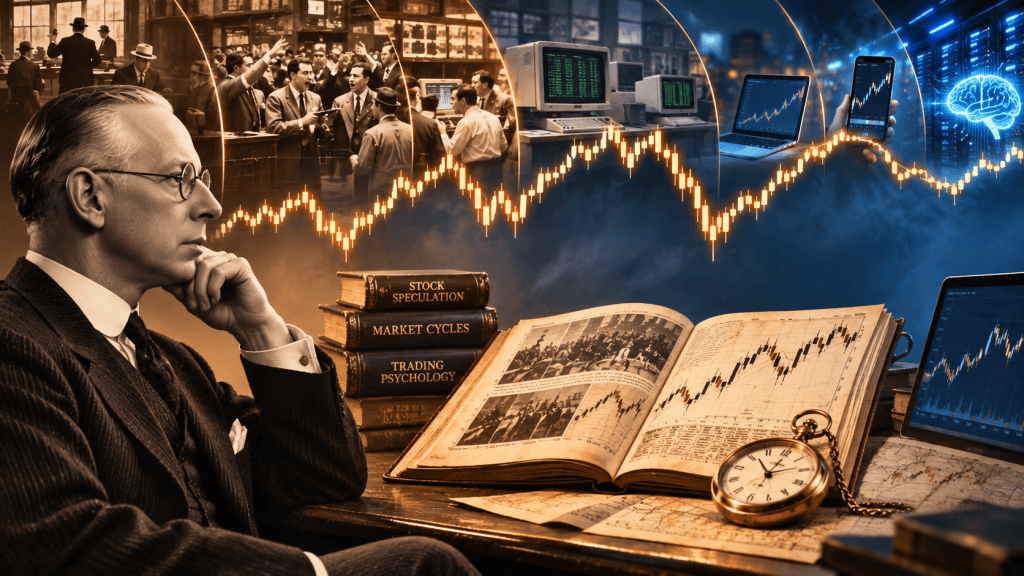
The names change. The technologies change. The headlines change. But the emotions driving the stock market remain remarkably consistent. Traders who understand historical market analogs have an advantage over those who believe every market environment is unprecedented.
Winston Churchill famously said: “Those who fail to learn from history are condemned to repeat it.” The principle behind these words is one every trader should understand. Markets have a long history of teaching the same lessons to new generations of investors, yet each generation seems determined to learn those lessons the hard way. We convince ourselves that the current environment is different, that new technologies have permanently changed the rules, or that the latest economic crisis is unlike anything we’ve ever experienced. Meanwhile, the same patterns of greed, fear, speculation, panic, and recovery continue playing out teh same way on our charts.
Jesse Livermore, one of the greatest speculators in market history, understood this better than almost anyone. In Reminiscences of a Stock Operator, the central lesson is that human nature doesn’t change, and because human nature doesn’t change, neither do the fundamental behaviors of the stock market. The faces change, the money changes, the technologies change, and the catalysts change, but the psychology driving price action remains remarkably consistent.
This is one of the most important concepts I teach traders: If you want to understand what the market is likely to do next, study what it did when similar conditions existed in the past. Not just what happened during the same month or at the same point in an election cycle, but what happened when the same combination of market structure, investor positioning, economic conditions, monetary policy, and sentiment came together.
History doesn’t give us a perfect roadmap. It gives us a framework for understanding probabilities. And in trading that distinction is everything.
The Problem With Trading Headlines Instead of Historical Context
Most traders approach the market backward. They wake up, read the headlines, look at the futures, and then attempt to explain why the market is moving. If inflation comes in hotter than expected, they assume stocks should fall. If the Federal Reserve signals lower interest rates, they assume stocks should rise. If a company reports exceptional earnings, they expect the stock to rally. When the market does the opposite, they become confused because their expectations were based on the news rather than the conditions surrounding that news.
Experienced traders know that the same headline can produce completely different reactions depending on the market environment. A Federal Reserve rate cut can be bullish when inflation is declining and economic growth remains healthy, but bearish when investors interpret it as evidence that the economy is deteriorating faster than expected. Strong earnings can trigger a breakout when a stock is emerging from a long consolidation, yet produce a sharp selloff when that same stock has already rallied 80% and investors are positioned for perfection.
The news is the catalyst. The underlying market conditions determine how that catalyst is absorbed.
This is why studying historical analogs is so valuable. When we find periods that resemble the current environment, we gain insight into how investors previously responded to similar circumstances. We can identify which sectors attracted capital, how volatility developed, which technical levels mattered, and whether the market’s initial reaction proved sustainable. Instead of being surprised by price action, we begin recognizing familiar behavior.
November Seasonality: A Perfect Example of Why Context Matters
We recently applied this approach to November seasonality during a midterm election year. The historical statistics appeared overwhelmingly bullish. In our study, 18 of the previous 21 midterm-election Novembers had produced positive returns. A trader looking only at that statistic might think that November was practically guaranteed to be a winning month. After all, an 18-out-of-21 record represents an 85.7% historical success rate. Why fight those odds?
But that isn’t how I believe historical analysis should work.
Rather than simply accepting the headline statistic, we examined the exceptions.
What happened during the three losing Novembers? What were the economic conditions? What was happening with interest rates, inflation, monetary policy, and investor sentiment? More importantly, were those losing periods more analogous to the environment we were entering than the 18 winning periods?
Our conclusion was that the combination of market data and news-related risks in 2026 bore a closer resemblance to the losing cases than to the typical bullish midterm November. That didn’t guarantee a decline, but it challenged the assumption that favorable seasonality alone was sufficient reason to become aggressively bullish.
As November unfolded, volatility reinforced the importance of that distinction. The market was not behaving like the smooth, bullish seasonal period many investors had anticipated.
This illustrates an essential lesson: The most useful historical comparison isn’t necessarily the most common outcome. It’s the outcome that occurred under the most similar conditions.
There is an important statistical caveat here. Three losing observations are a small sample, and historical similarities do not prove that the same outcome will follow. But identifying those similarities can help us challenge consensus expectations, recognize risk, and adjust position sizing before the crowd realizes that the familiar seasonal playbook may not apply.
The actual market reaction provided an excellent illustration. On November 4, the S&P 500 rallied nearly 2% following the election, while the Dow gained more than 3%. One day later, the S&P 500 plunged 4.36%, and the VIX jumped nearly 70%. Technology stocks led the selloff amid concerns surrounding AI investment and policy uncertainty.
That is the kind of environment in which relying blindly on seasonal averages becomes dangerous. The broader historical tendency may still be bullish over several months, but the path can be volatile enough to punish traders who are overleveraged, chasing breakouts, or unwilling to adjust when market conditions change.
The 2000 Dot-Com Bubble and Today’s AI Revolution
One of the most interesting historical analogs for today’s market is the technology boom of the late 1990s.
During that period, the internet was going to transform the global economy, and investors were willing to pay extraordinary valuations for companies promising to participate in that transformation. They weren’t necessarily wrong about the technology. The internet did change virtually every industry. The problem was that investors confused a revolutionary technology with the assumption that every company associated with it would become a profitable investment.
Consider Cisco Systems. During the internet boom, Cisco supplied the networking equipment that made the expansion of the internet possible. It was a real company with real products and significant earnings, not some speculative business with nothing more than a website. Nevertheless, its stock became so expensive during the bubble that even strong business fundamentals couldn’t prevent an enormous decline when investor expectations reset. Cisco lost roughly 90% of its value from its 2000 peak to its 2002 low.
Now consider the current AI revolution. Nvidia, Broadcom, Microsoft, Alphabet, and the companies building data centers are participating in a technological transformation that may be every bit as significant as the internet. But a revolutionary technology doesn’t eliminate the business cycle, competition, valuation risk, or the possibility that investors have already priced in years of exceptional growth.
The analogy isn’t that Nvidia must become the next Cisco or that AI is destined to collapse. That would be an overly simplistic interpretation of history. The analogy is that investors repeatedly extrapolate extraordinary growth too far into the future, and eventually the market begins questioning whether the return on investment will justify the enormous capital being deployed.
We are already seeing that tension. In late October 2026, weakness in AI-related stocks contributed to a broader market decline despite the S&P 500 having reached record highs earlier that month. Investors were balancing AI growth expectations against elevated Treasury yields, rising energy costs, and uncertainty surrounding future monetary policy.
As a swing trader, I’m not interested in predicting the exact day that an investment theme becomes overextended. I’m interested in recognizing the technical behavior that historically accompanies that transition. Are earnings breakouts holding? Are stocks making new highs on expanding volume, or are they repeatedly reversing after strong openings? Are former leaders finding buyers at their 20-day and 50-day moving averages, or are those averages becoming resistance? Is money continuing to flow into the sector, or are we seeing distribution beneath the surface?
These questions matter more than whether the latest AI earnings report sounds impressive. In 2000, investors who understood the difference between technological innovation and stock-market valuation had a substantial advantage. The same rule matters today.
The 2022 Bear Market: When the Fed Changes the Rules
Another useful historical comparison is 2022, when inflation forced the Federal Reserve into one of its most aggressive tightening moves in decades. Investors entered that period accustomed to an environment in which low interest rates, abundant liquidity, and central-bank support had rewarded buying market pullbacks. Many of the most popular growth stocks had enjoyed spectacular advances during 2020 and 2021, and traders assumed those trends would resume after each correction.
But the underlying environment had changed.
As inflation accelerated, the Federal Reserve raised interest rates, bond yields climbed, and investors became less willing to pay extraordinary multiples for companies whose profits were expected many years into the future. The Nasdaq Composite fell roughly 33% in 2022, while the S&P 500 declined about 19%. Many speculative growth stocks suffered substantially greater losses.
The important lesson wasn’t that rising interest rates are bad for stocks. Markets are more complicated than that. The lesson was that a strategy that works exceptionally well in one environment can become a losing strategy when the regime changes.
Think about how traders approached pullbacks in 2021. Buying a leading growth stock near its 20-day moving average often worked because institutions were aggressively accumulating shares and monetary conditions were ideal. In 2022, the same technical setup frequently failed because the broader market was experiencing persistent distribution. Stocks would bounce into declining moving averages, attract hopeful buyers, and then roll over to new lows.
The setup looked the same, but the environment was completely different.
That is why I emphasize that we must trade the market in front of us rather than the market we wish existed. When the Federal Reserve is fighting inflation, Treasury yields are rising, and market breadth is deteriorating, I don’t want to blindly apply the same aggressive breakout strategy that worked during a liquidity-driven bull market.
In 2026, we have faced another environment in which energy prices, inflation concerns, and uncertainty over Federal Reserve policy have complicated the bullish narrative. This is not an exact replay of 2022, but the relationship between inflation, interest rates, growth-stock valuations, and market volatility is in play.
History tells us to pay attention to the regime, not just the chart pattern.
The 2020 COVID Crash: Why the Market Often Moves Before the News Improves
The COVID crash provides another important lesson about historical analogs, particularly the relationship between news and price action. In February and March 2020, markets collapsed as the world confronted an black swan event and economic shutdown. The S&P 500 fell approximately 34% in little more than a month. Businesses closed, unemployment surged, and the economic outlook appeared disastrous.
Yet the stock market bottomed on March 23, 2020, long before the economy recovered or the public-health crisis ended. Stocks began advancing while the headlines remained overwhelmingly negative.
Why?
Because markets are forward-looking, and investors began responding to extraordinary monetary and fiscal support, improving liquidity conditions, and expectations about what the economy might look like months into the future. The news remained terrible, but the market was beginning to discount a less terrible future.
We have seen versions of this behavior repeatedly throughout market history. The 2009 bull market began while the economy was still struggling through the financial crisis. The market recovery following the 2022 bear market began before every inflation concern had been resolved. The bottom often occurs when conditions are still bad but the rate of deterioration is beginning to slow.
This is especially relevant to my bottom-formation trading strategies. I look for capitulation, selling exhaustion, successful retests, higher lows, and eventually the remounting of important moving averages. A stock may still have terrible news surrounding it, but if sellers can no longer push it to new lows, that change in price behavior deserves attention.
The historical analogy helps us recognize the possibility of a bottom. The price action tells us whether buyers are actually beginning to take control.
The 2018 Fourth-Quarter Selloff: Strong Seasonality Can Fail
The fourth quarter of 2018 is another example worth studying. Stocks entered the final months of the year facing Federal Reserve tightening, trade tensions between the United States and China, and growing concerns about global economic growth. Investors had become accustomed to strong corporate earnings and a long-running bull market, yet the market began responding negatively to the combination of tighter monetary conditions and deteriorating sentiment.
December is traditionally considered a favorable seasonal period for stocks, particularly because of the so-called Santa Claus rally. But in December 2018, the S&P 500 declined more than 9%, one of its worst December performances in modern history. From its September high to its December low, the index experienced a drawdown approaching 20%.
Imagine a trader entering that month with an aggressive long portfolio simply because December had historically produced positive returns. The seasonal statistic might have been correct on average, but it provided little protection against the actual conditions driving that particular market.
Now imagine another trader who studied previous periods of Federal Reserve tightening, weakening breadth, and declining investor confidence. That trader might have recognized that the environment was more important than the calendar and reduced exposure, tightened risk, or shifted toward shorter-duration trades.
Neither trader could know the future. But one was approaching the market with a more complete understanding of historical probabilities.
This is the distinction we were making with November 2026. The bullish seasonal record was real within our dataset, but the circumstances surrounding the current market deserved greater weight than the average historical return.
Sector Rotation: The Same Capital Flows Into Different Industries
Historical analogs are not limited to major market crashes or macroeconomic cycles. Some of the most useful comparisons involve sector rotation, an area I believe traders consistently underestimate.
During the 2020 pandemic, technology companies benefiting from remote work, e-commerce, and digital transformation attracted enormous investor interest. Zoom, Shopify, and many software companies became market leaders. Meanwhile, airlines, hotels, energy companies, and other economically sensitive businesses struggled as economic activity collapsed.
As reopening expectations strengthened in late 2020 and 2021, capital began rotating toward many of the sectors that had previously been left behind. Energy, financials, industrials, and reopening-related businesses attracted renewed interest. Traders who remained exclusively focused on the previous year’s technology leaders often missed opportunities developing elsewhere.
A similar rotation occurred during the inflationary environment of 2022. While speculative technology and other long-duration growth stocks struggled, energy companies benefited from elevated commodity prices and strong cash flows. Exxon Mobil was one of the standout large-cap performers that year, demonstrating that even during a broad bear market, capital can find a home in industries benefiting from the prevailing economic conditions.
This is why I spend so much time examining sector ETFs such as SMH, XLE, XLF, XLI, and XLY. Before selecting individual stocks, I want to understand where institutional money is flowing. If semiconductor stocks are repeatedly failing breakouts while industrials are making constructive consolidations and attracting volume, that information matters. If software stocks are breaking below their 50-day moving averages while energy stocks are holding support, that divergence deserves attention.
The historical pattern is familiar. Capital rotates from areas where expectations have become excessive toward areas offering improving earnings, more attractive valuations, or favorable economic conditions.
The industries change. The process doesn’t.
How I Use Historical Analogs in My Own Trading
The biggest mistake traders can make with historical analogs is turning them into rigid predictions. If the market resembles 2000, that doesn’t mean we’re about to experience another dot-com collapse. If it resembles 2022, that doesn’t guarantee another prolonged bear market. And if November resembles previous losing midterm-election Novembers, that doesn’t mean the month must finish negative.hh
An analogy is a hypothesis, not a trading signal.
My approach is to begin with the broader market environment. I want to understand the direction of monetary policy, inflation trends, Treasury yields, market breadth, investor sentiment, and sector leadership. I then compare those conditions with historical periods in which similar forces were present. From there, I study the price action to determine whether the market is behaving in a manner consistent with that analogy.
For example, suppose the Nasdaq is rallying into resistance after a sharp correction, but fewer stocks are participating in the advance. The leading semiconductor names are struggling to regain their 20-day moving averages, the VIX remains elevated, and each positive earnings reaction is being sold. That combination may resemble previous bear-market rallies more closely than sustainable bull-market advances.
In that environment, I might reduce the size of new long positions, avoid chasing extended breakouts, take a more selective approach to options, or focus on stocks demonstrating genuine accumulation. I might also look for rubber-band opportunities when stocks become excessively stretched into important support or resistance levels.
Now consider the opposite environment. The major indexes have experienced a correction, sentiment is extremely negative, but market breadth begins improving. Former leaders stop making new lows, more stocks reclaim their 20-day and 50-day moving averages, and earnings breakouts begin holding their gains. That behavior may resemble previous market recoveries rather than the beginning of another major decline.
In that environment, I become more interested in bottom formations, episodic pivots, earnings power gaps, and continuation patterns as new leadership develops.
The historical analogy informs my expectations, but price action determines my trades. I don’t buy because a particular year looks like 2009, and I don’t short because a chart resembles 2000. I trade when the current market confirms a setup with an attractive risk-reward relationship.
This also helps prevent one of the most destructive habits in trading: becoming emotionally attached to a market opinion. If I believe the market is vulnerable because historical conditions resemble a previous correction, but breadth begins expanding and leading stocks start breaking out on heavy volume, I have to respect that evidence. My job isn’t to prove that my historical comparison was correct. My job is to make money while managing risk.
The Psychology Behind Why History Keeps Repeating
Livermore’s greatest insight was not about a particular chart pattern or trading technique. It was about human behavior.
Every generation of investors believes it possesses information, technology, or analytical tools that previous generations lacked. Today’s traders have access to real-time financial data, algorithmic trading systems, artificial intelligence, sophisticated options analytics, and virtually unlimited historical research. Yet investors continue to chase extended stocks, panic during corrections, sell winners too early, hold losers too long, and confuse a compelling story with a profitable investment.
The technology has improved enormously. Human psychology hasn’t kept pace.
Consider the speculative behavior surrounding the dot-com boom, the housing bubble of the mid-2000s, the meme-stock mania of 2021, and the periodic enthusiasm surrounding cryptocurrencies and artificial intelligence. The assets and narratives are different, but the underlying behavior is remarkably similar. Investors observe other people making extraordinary returns, become fearful of missing out, and gradually abandon the risk-management principles they followed before the excitement began.
Eventually, the market reaches a point where expectations exceed what reality can deliver. Selling begins, confidence deteriorates, and the same investors who couldn’t imagine prices falling suddenly become convinced that prices will never recover.
This cycle is as old as financial markets themselves.
The psychology also operates on a smaller scale within individual trades. A stock breaks out, attracts momentum buyers, becomes extended, and eventually experiences profit-taking. Late buyers panic during the pullback, stronger hands begin accumulating shares near support, and the stock either resumes its advance or breaks down depending on the balance between supply and demand.
These patterns repeat because the emotions and incentives driving market participants repeat. That is the foundation of technical analysis. Chart patterns aren’t magical formations. They are visual representations of human behavior expressed through price and volume.
Once you understand that, studying market history becomes much more than an academic exercise. It becomes a way of recognizing the psychological conditions that produce recurring opportunities.
The Danger of Finding the Historical Comparison You Want to See
There is one additional lesson that deserves attention. Historical analogs can be extremely useful, but they can also become dangerous when traders use them selectively.
If I’m bullish, I can almost always find a previous market period that supports my bullish outlook. If I’m bearish, I can find a historical crash with similar characteristics. Given enough years, indicators, and economic variables, almost any market environment can be made to resemble something from the past.
That is not analysis. That is confirmation bias.
The solution is to examine competing analogs rather than searching exclusively for evidence supporting an existing opinion. If the market resembles 2022 because of inflation and interest-rate uncertainty, I should also consider periods when stocks advanced despite those same concerns. If valuations resemble the late 1990s, I need to examine whether corporate earnings, balance sheets, and market concentration are sufficiently different to weaken that comparison.
I also want to identify what would invalidate my hypothesis. If I expect a correction based on deteriorating breadth, what happens if breadth begins expanding? If I anticipate a failed breakout because of restrictive monetary policy, what happens if the breakout succeeds and institutional buying accelerates?
A useful historical analog should produce testable expectations. It should tell us what to watch, what would strengthen the comparison, and what would cause us to abandon it.
Otherwise, we aren’t learning from history. We’re simply using history to justify our opinions.
The Real Edge: Recognizing the Environment Before Everyone Else
There is an enormous difference between knowing that November has historically been bullish and understanding why a particular November might behave differently. There is a difference between recognizing that AI resembles the internet revolution and assuming every AI stock will follow the same trajectory as the dot-com companies. And there is a difference between knowing that markets eventually recover and identifying the technical evidence that a recovery may be underway.
The first is information. The second is analysis.
As traders, our objective is not to predict every market movement. That is impossible. Our objective is to identify environments where historical probabilities, current conditions, and price action align in our favor. When those factors agree, we can become more aggressive. When they conflict, we should become more selective, preserve capital, and wait for clarity.
This is where patience becomes a competitive advantage. The trader who feels obligated to participate every day will often force trades in environments where the historical evidence is mixed and the price action is unreliable. The trader who understands market cycles recognizes that some environments reward aggression while others reward defense.
The same setup can produce dramatically different results depending on when and where it occurs. An earnings breakout in a healthy bull market with expanding breadth is not the same opportunity as an earnings breakout during a volatile correction with deteriorating leadership. A pullback to the 20-day moving average during institutional accumulation is not the same as a rally into that moving average during a distribution phase.
Understanding those differences is how we develop a repeatable trading edge.
Final Thoughts: The Market Has Seen This Before
When I study the market, I constantly ask myself a simple question: When have we seen conditions like this before?
Not when have we seen the same headlines, because the headlines will always be different. Not when have we seen the same technology, because innovation continuously changes the economy. I want to know when we have seen the same combination of investor psychology, monetary conditions, sector rotation, market structure, and price behavior.
That is where the most useful historical lessons are found.
Our November 2026 seasonality analysis was a practical example. The overwhelming majority of previous midterm-election Novembers in our study had been positive, but the exceptions offered a warning that the headline statistic couldn’t capture. By examining the circumstances surrounding those exceptions, we recognized the potential for volatility that many traders relying exclusively on seasonality might have overlooked.
That doesn’t mean the historical analogy will correctly predict November’s final return. It means we were better prepared for a market that didn’t follow the most popular seasonal narrative.
And preparation is one of the most valuable advantages a trader can possess.
Churchill’s attributed warning reminds us of the danger of ignoring history. Livermore’s philosophy explains why that history remains relevant: human nature doesn’t change. Fear, greed, hope, impatience, overconfidence, and the desire to follow the crowd are as powerful today as they were a century ago.
The market will continue introducing new companies, new technologies, new economic challenges, and new reasons for investors to believe that this time is different. But underneath those changing circumstances, the same behavioral forces will continue shaping price action.
The market doesn’t have to repeat the past exactly for the past to teach us how to trade the present.
The traders who understand that will spend less time being surprised by market behavior and more time preparing for it.
And in the trading game, preparation is everything.
I currently have a short window to take on 1-2 mentorees. Information on Personal Mentoring.
For more on swing trading check out my swing service at bullsonwallstreet.com and 7 Day Trial


Leave a Reply