
Game Theory
Most traders are taught to look at the market in one of two ways.
Fundamental traders study earnings, revenue growth, valuations, economic conditions, and the underlying quality of a business. Technical traders focus on price, volume, trends, moving averages, support and resistance, and recognizable chart patterns. I use elements of both, but there is another way of looking at the market that can add an entirely different dimension to your trading: game theory. Once you understand the basic idea, you begin to realize that a stock chart isn’t simply a collection of prices moving up and down. It is a record of decisions being made by millions of participants who have different positions, different expectations, different time horizons, and, most importantly, different incentives. Every price level represents traders who bought, traders who sold, traders who missed the move, traders who are trapped, and traders waiting for something to happen before they act.
Game theory is a branch of economics and mathematics concerned with strategic decision-making. The central idea is relatively simple: your best decision often depends on what other people decide to do, while their decisions depend partly on what they believe you and everyone else will do. Chess is an obvious example. You don’t make a move simply because that move looks attractive in isolation; you make it while considering how your opponent is likely to respond.
Trading works in much the same way. You can believe a company is worth $100 per share, but if everyone else believes it is worth $70, your personal valuation isn’t going to make the stock trade at $100 tomorrow. Conversely, a stock you consider ridiculously expensive can continue rising because other market participants remain willing to pay increasingly higher prices for it.
This changes one of the fundamental questions we should ask as traders. Instead of simply asking, “Why should this stock go up?”, we can ask, “What are the other participants in this stock likely to do if it goes up?” Better yet, we can ask, “Who will be forced to change what they’re doing if price reaches a certain level?”
That distinction is important for momentum traders because some of the strongest moves occur when price reaches a point where the incentives of several groups change at approximately the same time. A breakout can attract new buyers while simultaneously forcing shorts to cover. A failed breakout can cause recent buyers to dump their shares while attracting new short sellers. A gap-down reversal can turn traders who confidently shorted bad news into forced buyers. The chart shows us where these changes may happen; game theory gives us a framework for thinking about why they happen.
Every Chart Has Incentivized Players
Suppose a stock is trading around $100 and has repeatedly failed at $105. A traditional technical analysis says that $105 is resistance, and that’s perfectly valid.
But I want to know more than that. I want to understand what is happening around $105 and why that particular price might matter. There are probably existing shareholders who have watched the stock fail there before and plan to take profits as it approaches the level again. There may be short sellers who believe the previous failures make $105 an attractive place to initiate a bearish position. At the same time, breakout traders are watching the exact same level and waiting for the stock to push through it. Institutions that like the company but want technical confirmation may also be watching, while traders who previously sold near $105 could be waiting to see whether they need to buy the stock back.
Now imagine the stock trades from $103 to $104, then $104.75, $105, $105.50 and eventually $106. From a purely technical perspective, resistance has been broken. From a game-theory perspective, something much more interesting has occurred: the incentives of multiple groups have changed at approximately the same price. The short seller who was comfortable defending $105 suddenly has a losing position. The breakout trader who had no reason to buy at $104 now has a reason to buy. The investor waiting for confirmation has received it. A shareholder who planned to take profits at resistance may decide to hold because the stock appears to be entering a new leg higher. If the stock continues toward $107 or $108, more short sellers may decide that their original thesis has failed and begin covering their positions.
This is why I don’t think of a breakout simply as a stock crossing a line on a chart. I’m interested in whether crossing that line creates a change in behavior. The best levels are often the ones where several groups are watching the same thing because those are the levels capable of producing coordinated action. When buyers enter at the same time that sellers withdraw and short sellers begin covering, you have the potential for an imbalance between supply and demand. That imbalance is what can turn an ordinary breakout into an explosive one.
Who Is Trapped?
One of the most useful questions I have learned to ask when evaluating a setup is remarkably simple: Who is trapped if I’m right?
I don’t mean that every good trade requires a group of traders to be trapped, but when a setup does contain trapped participants, it can provide an additional source of fuel for the move. This is especially relevant to the type of momentum trading I do because traders who are on the wrong side of a move eventually have to make another transaction to get out. A short seller has to buy shares to cover. A breakout buyer whose trade fails has to sell. In both cases, the original positioning can eventually contribute to movement in the opposite direction.
Consider an earnings breakout.
A company reports strong results and the stock gaps from $80 to $88 on heavy volume. Over the next several sessions, instead of immediately continuing higher, the stock consolidates between approximately $86 and $89. Some traders look at the move and conclude that the stock has gone too far too quickly, so they short it. Other traders who owned the stock before earnings use the strength to take profits. Meanwhile, investors who missed the original gap wait for a better entry. Despite all of this potential selling pressure, the stock refuses to break down. Then it pushes through $90 on expanding volume.
Think about the game that has just developed.
The traders who shorted $88 or $89 because they expected the earnings gap to fade are now losing money. Breakout traders who were waiting for $90 begin buying. Investors who wanted proof that the earnings move could hold may now be willing to participate. Existing shareholders see a new high and may become less interested in selling. If the stock reaches $91, $92 or $93, some of the shorts eventually decide that they were wrong and cover their positions. Since covering a short requires buying shares, the traders who originally represented potential selling pressure have now become another source of demand.
This is one reason a good breakout can accelerate after it clears an obvious level. It isn’t necessarily because thousands of investors suddenly discovered something new about the company’s fundamentals at exactly $90. The information may have been available for days. What changed was the payoff structure for the participants already involved in the stock. Below $90, the short sellers could still argue that resistance was holding. Above $90, that argument becomes progressively harder to maintain. The stock hasn’t merely changed price; it has changed the strategic situation.
Forced Buyers and Forced Sellers
This leads to a distinction that I think traders should spend much more time thinking about: the difference between someone who wants to transact and someone who increasingly needs to transact.
Markets are full of discretionary buyers and sellers. An investor may want to own a stock at $100 but decide not to buy if it reaches $103. That demand can disappear instantly. Forced behavior is different. A short seller watching losses grow, a leveraged trader facing margin pressure, a fund constrained by risk limits, or a breakout trader whose stop has been triggered may have less discretion about what to do next.
Imagine a heavily shorted stock approaching major resistance. Short interest by itself doesn’t make the stock a good trade; a heavily shorted company can continue falling for perfectly legitimate reasons. The interesting situation occurs when price begins doing something that challenges the short thesis. If the stock breaks an important level on strong volume and continues higher, the shorts now have to decide how much adverse movement they are willing to tolerate. Some will cover immediately. Others will wait. But every additional move higher increases the pressure on the remaining shorts. Their eventual covering adds buying pressure to the same move that caused their losses in the first place.
The reverse happens with failed breakouts. Suppose a stock has obvious resistance at $50 and finally breaks through it, running to $51.50. Breakout traders enter, momentum traders chase the move, and short sellers who had been defending $50 cover. Then the stock suddenly reverses and falls back below $50. Everyone who bought the breakout is now in a deteriorating position. Some traders have stops just beneath the breakout level, while others decide manually that the setup has failed. As the stock falls to $49.50 and then $49, those recent buyers become sellers at the same time that traders who specialize in failed breakouts begin establishing short positions. The very setup that initially created demand can now create supply.
This is why failed patterns can produce moves that are much sharper than traders expect. A failed breakout isn’t merely the absence of a successful breakout. It can become an entirely new setup because a large population of traders may have positioned themselves based on the original signal. When the signal fails, all of those positions become potential fuel in the opposite direction.
Markets Trade Expectations, Not Headlines
Game theory becomes particularly valuable around earnings and other catalysts because markets don’t respond to information in isolation. They respond to information relative to what participants expected and how they were positioned before the information arrived.
This explains something that confuses newer traders constantly: a company can report excellent earnings and fall 10%, while another company reports seemingly terrible results and rallies 15%.
The reason is that “good” and “bad” are incomplete descriptions of market information. Suppose a company grows earnings 30%. That sounds fantastic, but if investors were positioned for 40% growth, the report can still represent a disappointment. Conversely, a company whose earnings decline 10% may rally sharply if investors had feared a 30% decline. A useful mental model is Market Reaction ≈ Reality − Expectations.
This isn’t intended to be a literal mathematical pricing equation, but it captures something essential about trading: what matters isn’t simply what happened, but how what happened compares with what market participants had already anticipated.
Positioning adds another layer. Imagine that almost everyone expects a company to report exceptional results. Analysts are bullish, investors are heavily positioned long, and the stock has rallied 40% into the report. The company then delivers excellent numbers, but the stock falls. The first-order thinker says, “This doesn’t make sense. Earnings were great.” The game-theory trader asks a different question: “If almost everyone was already bullish and already owned the stock, who was left to buy after the report?” Great news doesn’t guarantee additional demand if that news was already reflected in expectations and positioning.
This is why I pay enormous attention to the reaction to the news rather than simply the news itself. Price action can reveal something about expectations that the headline cannot. If supposedly great news can’t push a stock higher, that is information. If terrible news can’t push a stock lower, that is also information. The market is telling you something about the balance between positioning, expectations, supply and demand.
Why Gap-Down Reversals Can Be So Powerful
The gap-down reversal is one of my favorite examples because it demonstrates game theory almost perfectly. Suppose a company reports disappointing earnings after the close and the stock is down 8% in premarket trading. The obvious interpretation is bearish. Existing shareholders panic, short sellers see an opportunity, and traders expect the stock to continue lower once the market opens. At first, everything appears to support that conclusion.
Then something unexpected happens. The market opens and the stock doesn’t continue falling. Buyers absorb the selling. It begins recovering the gap, moves through important intraday levels, and eventually approaches the previous day’s closing price. Maybe it even turns green. The earnings report hasn’t changed. The company’s numbers are exactly the same as they were when the stock was down 8%. What has changed is the market’s response to those numbers.
Now think about everyone who acted on the obvious interpretation. Traders who shorted the gap expecting continuation are suddenly underwater. Existing shareholders who were thinking about selling may decide not to because the stock is demonstrating strength. Contrarian traders begin noticing the reversal. Momentum traders join as resistance levels are reclaimed. Eventually some of the original shorts have to cover, which creates additional buying pressure.
This is where second- and third-order thinking become so valuable. First-order thinking says, “Bad earnings are bearish.” Second-order thinking says, “Other traders will see bad earnings and sell.” Third-order thinking asks, “What if everyone sees the bad earnings, sells or shorts the stock, and the stock still refuses to go down?” At that point, the failure of the expected reaction becomes more interesting than the original catalyst itself.
That principle extends far beyond earnings. Whenever a market is presented with information that should produce a particular response and the expected response fails to materialize, pay attention. The failure itself may be telling you that positioning has become extreme or that underlying demand and supply are different from what the headline suggests.
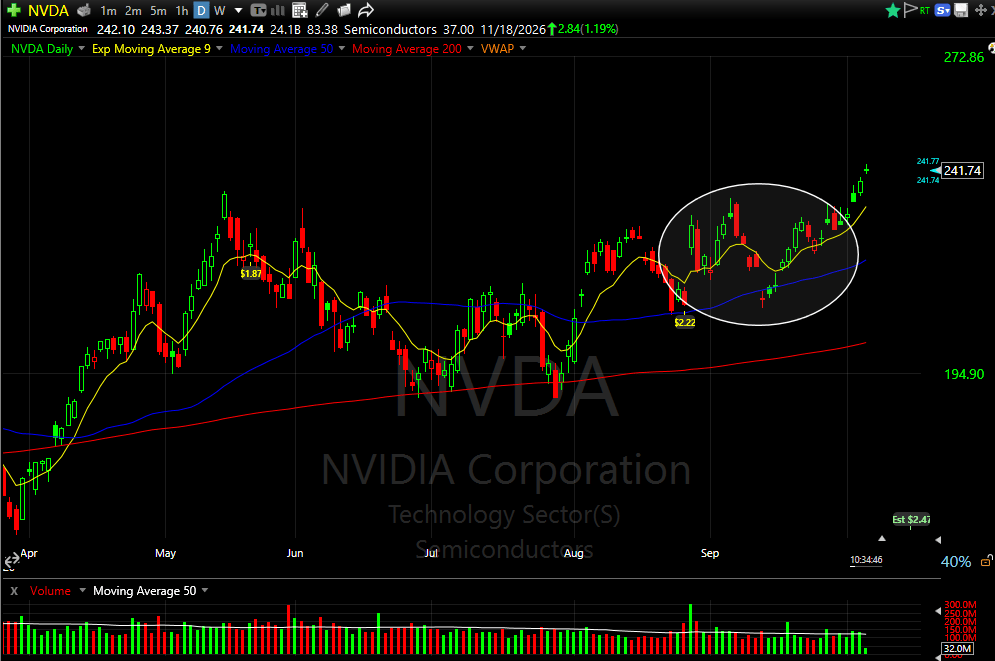
Support and Resistance as Coordination Points
Game theory also gives us a better explanation for why support and resistance matter. There is nothing inherently magical about a stock price of $50, $100 or $200. A prior high doesn’t contain some invisible force that physically prevents a stock from moving higher. These levels matter because market participants see them, remember them and place orders around them.
Suppose a stock has failed at $100 three times. Existing shareholders may plan to take profits there because they remember the previous failures. Short sellers may view $100 as an attractive entry because the level has held before. Breakout traders set alerts just above it. Short sellers place protective stops above it. Institutions may wait for the stock to establish itself above $100 before adding exposure. Algorithms trained to recognize technical levels may be responding to the same information. The level becomes important because everyone expects everyone else to consider it important.
In game theory, this resembles the concept of a focal point, often associated with economist Thomas Schelling. When people need to coordinate without directly communicating, they frequently gravitate toward an obvious reference point. Markets are filled with these reference points: prior highs, prior lows, round numbers, earnings highs, all-time highs, major moving averages and obvious breakout levels. Traders don’t need to speak with one another for their behavior to cluster around these prices.
This is one reason I often prefer obvious technical patterns to unnecessarily complicated ones. Traders sometimes believe a setup must be obscure to provide an edge, but there are situations where the opposite is true. If you’re trading a breakout, you often want other market participants to see the same level because their reactions are part of what can create the move. A multi-month base sitting directly beneath an obvious all-time high can be powerful precisely because thousands of traders and institutions can identify the same inflection point.
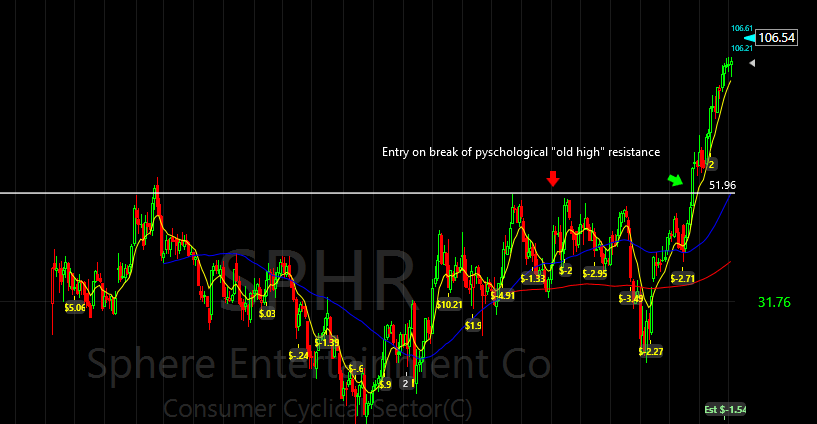
Failed Breakouts and Failed Breakdowns
Once you understand coordination points, failed moves become even more interesting. Imagine again that a stock has resistance at $50. Everyone sees the level, and eventually the stock breaks through it on what appears to be strong momentum. Breakout traders buy at $50.25, $50.50 and $51. Momentum traders join, while shorts who had been defending resistance cover their positions. The stock reaches $51.50, but then begins reversing. Soon it is back at $50.50, then $50, then $49.75.
At that point, the entire strategic structure of the trade has changed. The traders who bought the breakout expected old resistance to become new support. Instead, they’re underwater. Some have predetermined stops below $50, which begin triggering automatically. Others sell because they recognize that the breakout has failed. Short sellers who covered above $50 may now re-enter because the failure confirms their original bearish view. Traders who specialize in failed breakouts also enter. What was originally a bullish coordination point becomes a bearish one, and the buying created by the breakout can transform into selling pressure.
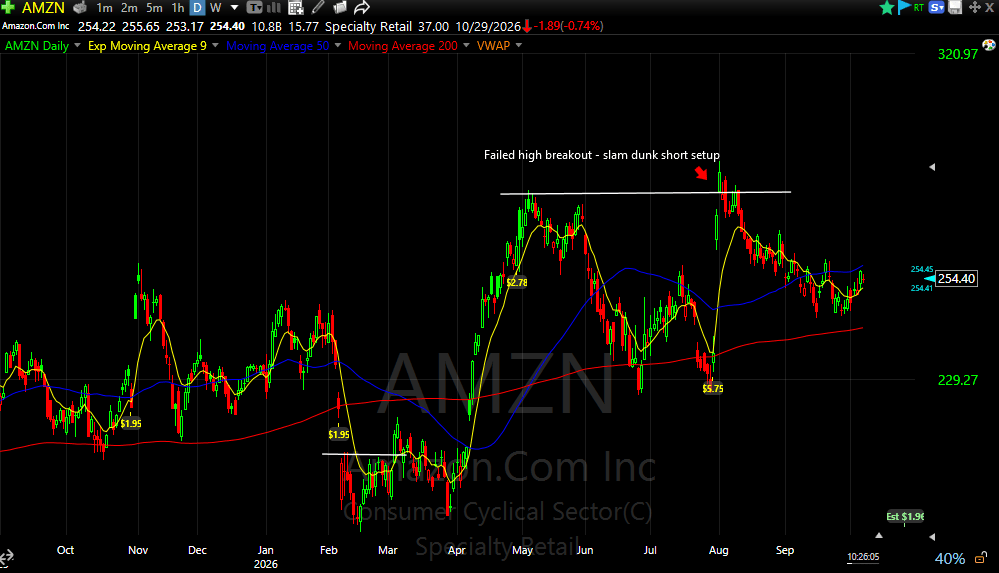
The same logic applies to failed breakdowns. Suppose a stock has repeatedly held support at $70. Eventually it flushes through $70 and trades down to $68. Weak shareholders panic and sell, stops are triggered, and breakdown traders establish short positions. But instead of continuing lower, the stock immediately recovers $70. The sellers who wanted out may already be gone, while the traders who shorted the breakdown suddenly find themselves trapped. As the stock moves back toward $71 and $72, those shorts may begin covering at the same time that reversal traders enter. The breakdown created the positioning that can help power the recovery.
In both cases, the important sequence is the same: an obvious level creates an expectation, the expectation creates positioning, the expected move fails, traders become trapped, and repositioning helps drive the move in the opposite direction. Once you learn to recognize that sequence, failed patterns stop looking like random chart noise and start becoming legitimate trading setups of their own.
Volume Tells You How Much Participation Is Behind the Move
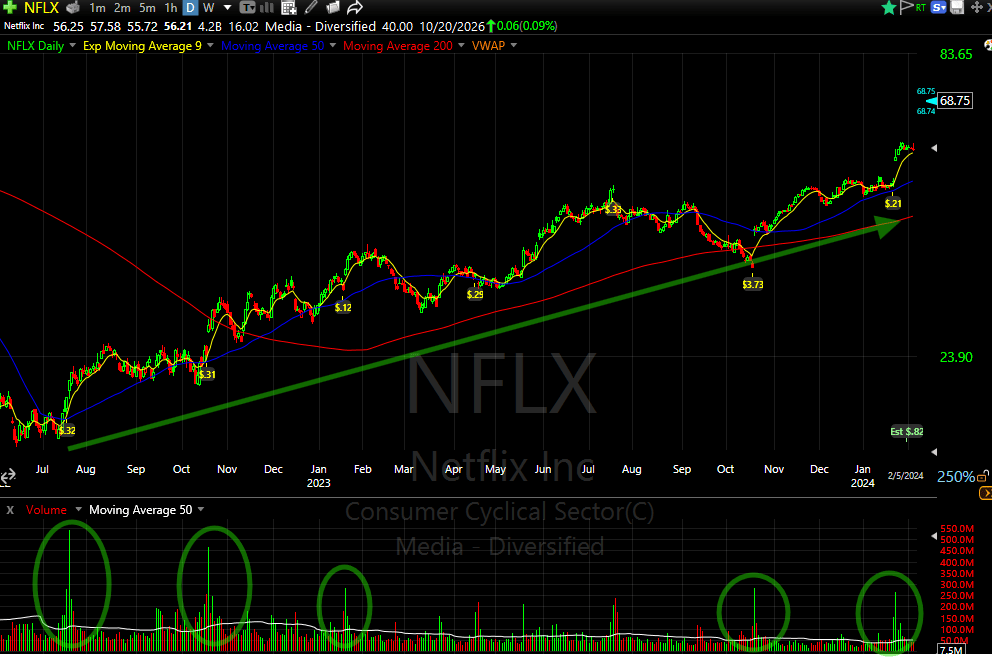
Volume takes on additional meaning when viewed through this framework. Most technical traders are taught that volume confirms price, which is true but somewhat superficial. What volume really tells us is how much participation is occurring. A breakout on ordinary volume means relatively few shares are changing hands compared with a breakout occurring on three or four times normal volume. The second situation suggests that a much larger number of participants are making decisions, establishing positions and transferring shares.
That matters because today’s transactions create tomorrow’s positioning. Today’s breakout buyers become tomorrow’s shareholders. Today’s short sellers become tomorrow’s potential buyers if they’re forced to cover. Today’s earnings-gap buyers become tomorrow’s potential sellers if the gap fails. A massive volume event therefore leaves behind what I like to think of as positioning memory. The market doesn’t literally remember what happened, but the participants holding positions certainly do.
This helps explain why high-volume earnings gaps, IPO breakouts, major reversals and all-time-high breakouts can remain important long after the original event. A tremendous amount of capital changed hands at those prices. When the stock eventually returns to those areas, many of the participants involved in the original event have decisions to make again.
Game Theory and Stop Placement
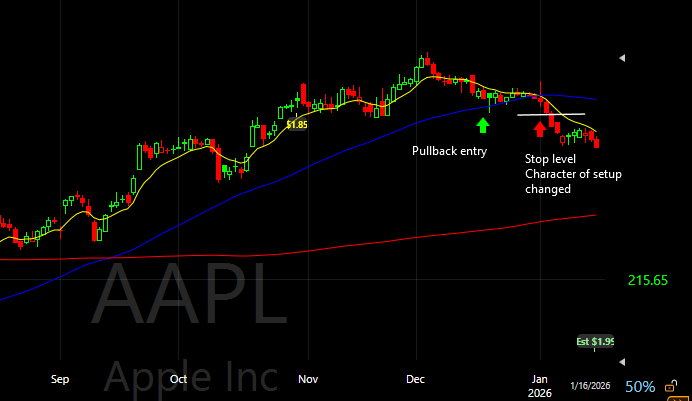
One of the most practical ways to incorporate this thinking into your trading is through stop placement. Many traders choose stops mechanically: 5% below entry, $1 below entry, two ATRs away, or some other predetermined amount. Mechanical stops can have value, particularly for systematic strategies, but for discretionary swing trading I also want to understand what price would tell me that the behavior I expected is no longer occurring.
Suppose I buy a breakout at $100 and place my stop at $97. The superficial explanation might be that $97 is below support. But I want a more complete reason. If the stock breaks $100, attracts buyers, and then falls through $97, perhaps that tells me the breakout failed, recent buyers are trapped, sellers regained control, and the market has rejected the very move that justified my entry. In that case, $97 isn’t simply the place where I’m unwilling to lose another dollar. It represents the point where the game I thought I was playing has materially changed.
This is a subtle but important distinction. A good stop should protect capital, but ideally it should also correspond with thesis invalidation. If I entered because I expected a certain group of participants to behave a certain way and price action demonstrates that they aren’t behaving that way, I don’t need to argue with the market. I can get out, keep the loss controlled and look for the next opportunity.
Combining Game Theory With Risk and Reward
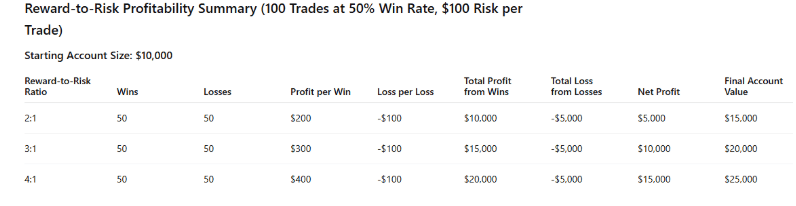
None of this replaces risk management. In fact, game theory becomes most useful when combined with a strict risk/reward framework because even the best analysis of positioning and incentives can be wrong. Suppose a stock breaks resistance at $100, the logical invalidation point is $97, and the next major target is approximately $109. I’m risking $3 to potentially make $9, giving me a 3:1 reward-to-risk opportunity.
Now the trade has several layers. The $100 entry isn’t arbitrary; it represents a level where I expect participant behavior to change. Breakout traders may enter, shorts may begin covering, and existing shareholders may become less willing to sell. The $97 stop represents the price where that hypothesis appears to be wrong because the breakout structure has failed. The $109 target represents an area where I believe new supply may emerge. Instead of saying, “I bought because the stock broke resistance,” I now have a complete hypothesis about who should act, why they should act, where I will know that I’m wrong, and whether the potential payoff justifies the risk.
For my own style of trading, I generally want at least 2:1 potential reward relative to the amount I’m risking, and I prefer 3:1, 4:1 or better when the setup provides it. Game theory doesn’t give me permission to abandon that discipline. If I can tell a wonderful story about trapped shorts but the chart only offers $2 of upside for $2 of downside, the trade isn’t attractive to me. The strategic setup and the mathematical payoff need to work together.
Applying Game Theory to the Earnings Breakout Pullback
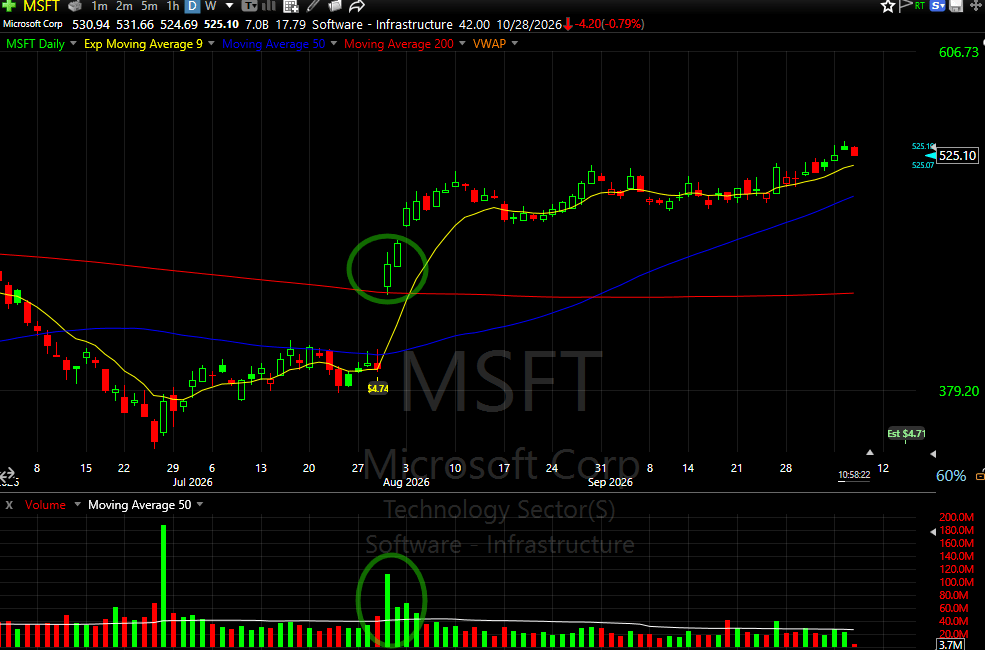
The earnings breakout pullback is particularly well suited to this type of analysis. Imagine a stock trading at $90 before earnings. The company reports results, the stock gaps to $100 on four times normal volume and then spends the next several sessions consolidating between $97 and $102. Instead of chasing the initial earnings move, I watch what happens afterward because the pullback and consolidation reveal how participants are responding to the new information.
Some shareholders who owned the stock before earnings are taking profits. Traders who believe the move was excessive may short the stock. Institutions that liked the report may be accumulating shares. Traders who missed the original move are waiting for an entry. If the stock repeatedly holds $97 or $98 despite profit taking and short selling, that’s useful information. The market has had an opportunity to reject the earnings move and hasn’t done so.
Now suppose the stock begins climbing again and breaks $102 on expanding volume. The traders who shorted the earnings gap may be trapped. Breakout traders enter. Investors who missed the initial gap receive a second opportunity. Institutions that were accumulating during the consolidation may add. Meanwhile, some of the profit taking that created the consolidation may already have been absorbed. If the technical structure gives me an entry around $102.50, an invalidation point around $98.50 and a realistic target around $114.50, I have approximately $4 of risk against $12 of potential reward, or roughly 3:1.
Notice how many pieces are working together. There is a catalyst, an abnormal volume event, a period of consolidation, evidence that the gap is being defended, an identifiable breakout level, potentially trapped shorts, new buyers entering and favorable risk/reward. That’s far more compelling than simply saying, “The stock reported good earnings.”
Sector Rotation Is a Game Too
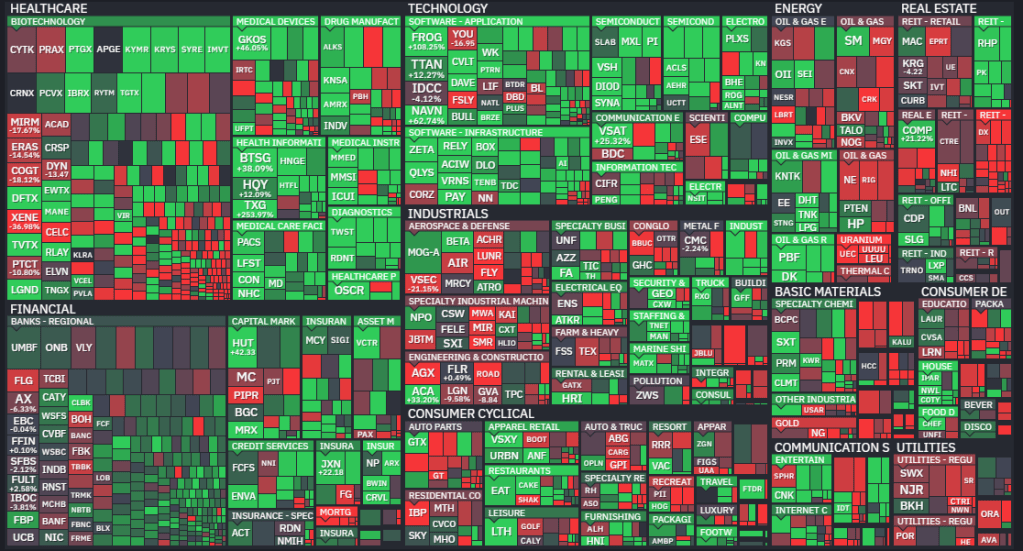
Game theory isn’t limited to individual stocks. It can also help explain sector and industry rotation, which is why I place so much emphasis on the top-down process of market → sector → industry → stock. Suppose semiconductor stocks begin outperforming the broader market. Initially, only a handful of leaders break out. Portfolio managers notice the relative strength, and capital begins moving toward the group. That additional demand pushes the strongest stocks even higher, making the industry’s relative performance look better and attracting still more attention.
Now imagine you’re a professional portfolio manager who is underweight semiconductors while the group continues outperforming your benchmark. Even if you weren’t originally bullish on the sector, your incentives begin changing. Remaining underweight creates a different kind of risk: the risk of falling behind competing funds or the benchmark you’re measured against. That can encourage managers to increase exposure, which sends additional capital into the same group. Eventually the money may spread from the obvious leaders into equipment makers, suppliers and secondary names.
This is one reason sector momentum can persist longer than traders expect. The initial price strength attracts capital, the new capital creates additional price strength, and the additional strength attracts even more capital. Eventually that feedback loop ends, but while it’s functioning it can be extremely powerful. It also explains why I would rather own a strong stock in a strong industry receiving capital than an isolated stock fighting against weak sector flows.
Reflexivity and the Feedback Loop
This feedback process is closely related to the concept of reflexivity, most famously associated in investing with George Soros. Traditional thinking often assumes that fundamentals determine price. Reflexivity recognizes that the relationship can run in both directions: fundamentals influence prices, but prices can also influence behavior and, in some circumstances, fundamentals themselves.
At the trading level, the simplest example is momentum. A stock rises, which attracts attention. The attention attracts buyers. Those buyers push the stock higher, which causes scanners to identify it, financial media to discuss it and more traders to notice it. The higher price can then attract additional capital, creating a self-reinforcing cycle. The same process can work in reverse. A falling stock damages sentiment, the deterioration in sentiment creates selling, and the selling pushes the stock even lower.
Momentum trading is partly about identifying these feedback loops while they’re strengthening and recognizing when they begin to break. That’s why relative strength, expanding volume, successful breakouts and constructive pullbacks matter so much. They can provide evidence that the feedback loop remains intact. Failed breakouts, abnormal selling and loss of important support can indicate that the game is beginning to change.
Don’t Turn Game Theory Into Storytelling
There is an important warning here. Once traders begin thinking about positioning, incentives and trapped participants, it becomes very easy to invent stories that can’t actually be verified. You’ll hear traders say things like, “Institutions are definitely accumulating this stock,” “Market makers are manipulating it,” or “The shorts have to cover tomorrow.” Those statements may sound sophisticated, but unless you have evidence, they’re simply narratives.
Game theory should make your analysis more disciplined, not more imaginative. I don’t need to know exactly what every hedge fund, institution or market maker is thinking. I couldn’t possibly know that. Instead, I want to create testable hypotheses based on observable behavior. Rather than saying, “The shorts are definitely going to cover,” I can say, “If meaningful short positioning exists and the stock breaks the level that invalidates the bearish setup, short covering could become an additional source of demand.” Then I let price and volume tell me whether that hypothesis is actually playing out.
This distinction is critical because trading is probabilistic. You can correctly identify a major resistance level, a powerful catalyst, heavy volume, sector strength, potentially trapped shorts and excellent risk/reward and still lose money. There is no game-theory formula that allows you to predict with certainty what thousands of independent participants will do. The goal isn’t certainty. The goal is to identify situations where the incentives appear favorable, define exactly what should happen if you’re right, know where the thesis is invalidated, and make sure the potential reward materially exceeds the amount you’re risking.
A Practical Game-Theory Framework for Every Trade
Before entering a trade, I like to mentally map the participants around the setup. First, I want to know what the market appears to expect and what the obvious interpretation of the chart or catalyst is. Then I identify the major price levels where behavior could change. I ask who is likely long, who may be short, who missed the move, and who is waiting for confirmation. Most importantly, I ask who becomes uncomfortable if my trade begins working and where those traders may eventually have to act.
From there, I want to know who comes next. If shorts cover a breakout, does that move attract momentum traders? If momentum traders enter, could the breakout attract institutions? If a stock is already in the strongest industry in the market, are sector flows providing another source of demand? I’m essentially looking for layers of potential participation. The more independent reasons different groups have to move in the same direction, the more interesting the setup becomes.
At the same time, I have to define what would invalidate that entire argument. If I’m buying an earnings breakout because the gap is being defended, what happens if the stock aggressively fills the gap? If I’m buying a breakout because I expect former resistance to become support, what happens if price immediately collapses back into the base? If I’m trading a gap-down reversal because sellers appear exhausted, what happens if the stock loses the reversal low? Those aren’t merely stop-loss questions. They’re questions about whether the other players are behaving the way my hypothesis predicted.
Finally, I run the numbers. Where is my entry? Where is the logical stop? Where is the next meaningful supply area or target? If I’m risking $2, can I reasonably make $4, $6 or $8? If the answer is no, I don’t care how interesting the game-theory argument sounds. A good trading idea without favorable risk/reward can still be a bad trade.
The Real Edge: Trade the Change in Behavior
The deeper lesson in all of this is that trading becomes much more interesting when you stop thinking exclusively about where a stock should go and begin looking for prices where other market participants may have to change what they’re doing. A breakout can force shorts to reconsider their positions. A failed breakout can force recent buyers to sell. A gap-down reversal can force bears to cover. An earnings breakout can force investors to reassess their assumptions. A sector breakout can force portfolio managers to reconsider being underweight. An unexpected reaction to news can force almost everyone to question the original consensus.
Those changes in behavior create order flow, and order flow creates price movement. This is ultimately what we’re trying to capture as traders. We don’t need to predict every decision made by every participant. We need to recognize situations where the incentives of enough participants may begin aligning in one direction and then structure a trade that allows us to participate without taking excessive risk if we’re wrong.
That’s why one of the most useful questions you can ask before entering a trade isn’t simply, “Why should this stock go up?” Ask, “If this stock starts going up, who else will have to respond?” Then ask the equally important question: “What would price have to do to prove that my interpretation is wrong?”
Put those questions together with price action, volume, catalysts, sector strength, disciplined stops and favorable risk/reward, and game theory stops being an abstract concept from an economics textbook. It becomes a practical framework for trading.
A resistance line is no longer simply a line. It’s a place where participants have positioned themselves. A breakout isn’t merely a stock moving through that line. It’s an event that can change the incentives of everyone positioned around it. A failed breakout isn’t merely a chart pattern that didn’t work. It’s a situation where the traders who acted on the original signal may suddenly become trapped. An earnings reaction isn’t simply the market responding to a number. It’s the market revealing the difference between expectations, positioning and reality.
Once you begin looking at markets this way, the chart starts telling a much richer story. You’re still analyzing price, volume, trends, support, resistance, catalysts, sectors and risk/reward, but underneath all of those things you’re asking a deeper set of questions: Who is positioned here? What are they expecting? What happens if those expectations are wrong? Who gets trapped? Who may be forced to act? And can that change in behavior create an asymmetric opportunity where I can risk one dollar to potentially make two, three or four?
That, to me, is the practical value of game theory in trading. Don’t just identify the pattern. Understand the players inside the pattern.
Want more insights on trading?
For more on swing trading check out my swing service at bullsonwallstreet.com and 7 Day Trial
Follow me on twitter and instagram.
Information on Personal Mentoring.
Author Bio
Paul J Singh is a 20+ year trader, Bullonwallstreet.com Swing Trading Coach, and swing trading mentor. He teaches traders how to combine technical analysis, options, risk management, and performance psychology into a repeatable edge.


Leave a comment