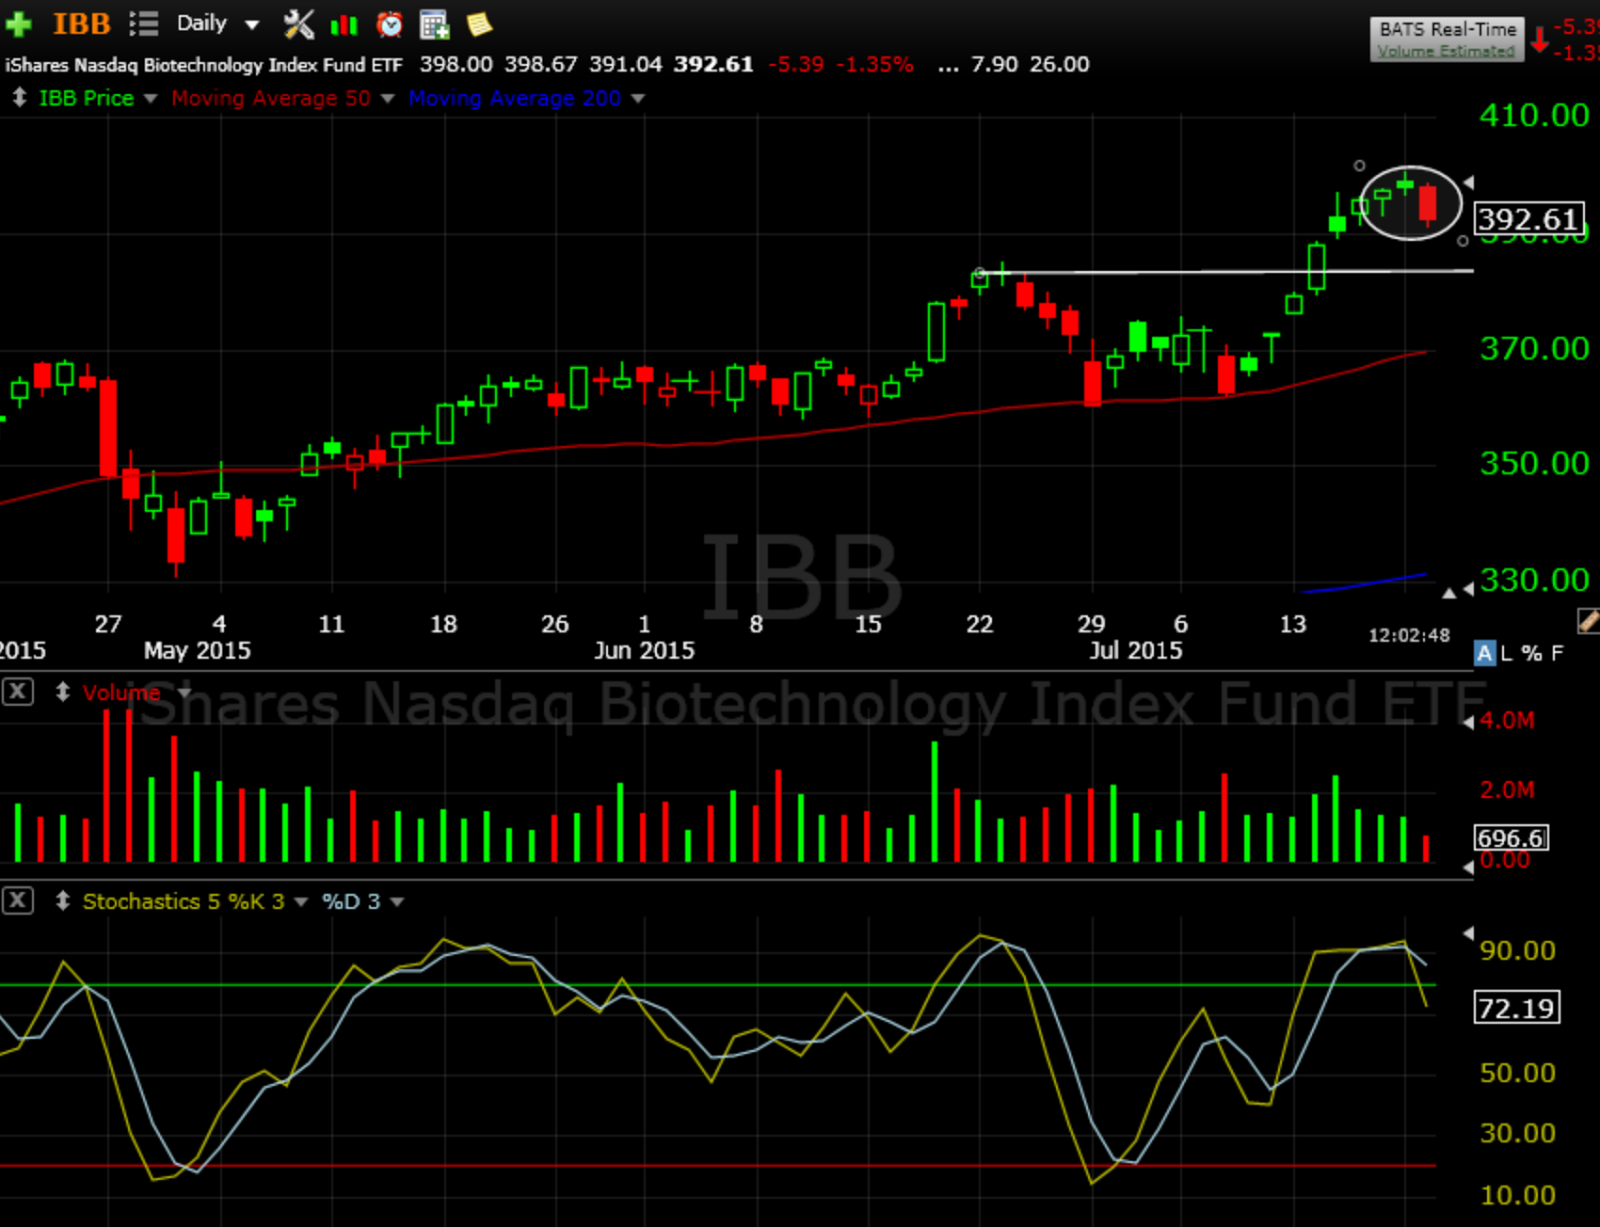
Biotech ETF IBB has been on a spectacular run since the market selloff, but now the chart is telling us that it looks ready to rest. Intraday today a negative candle pattern is forming at overbought conditions. If this pattern can hold going into the close, we could see a pullback. Two key levels are the old pivot high at $382, and the 50 dma at $370. These areas provide initial targets for the expectation of a shallow pullback. I would not get more ambitious with targets until IBB gives a strong signal of a deeper correction since it’s been so resilient over the past year.
Please retweet if you liked this article! Tweet
Subscribe to The Market Speculator by Email and never miss a post!
If you would like to learn more about how I trade, receive my nightly focus list with market analysis, setups and trade alerts, sign up for a 14 day free trial at BullsonWallStreet.com.

Leave a comment