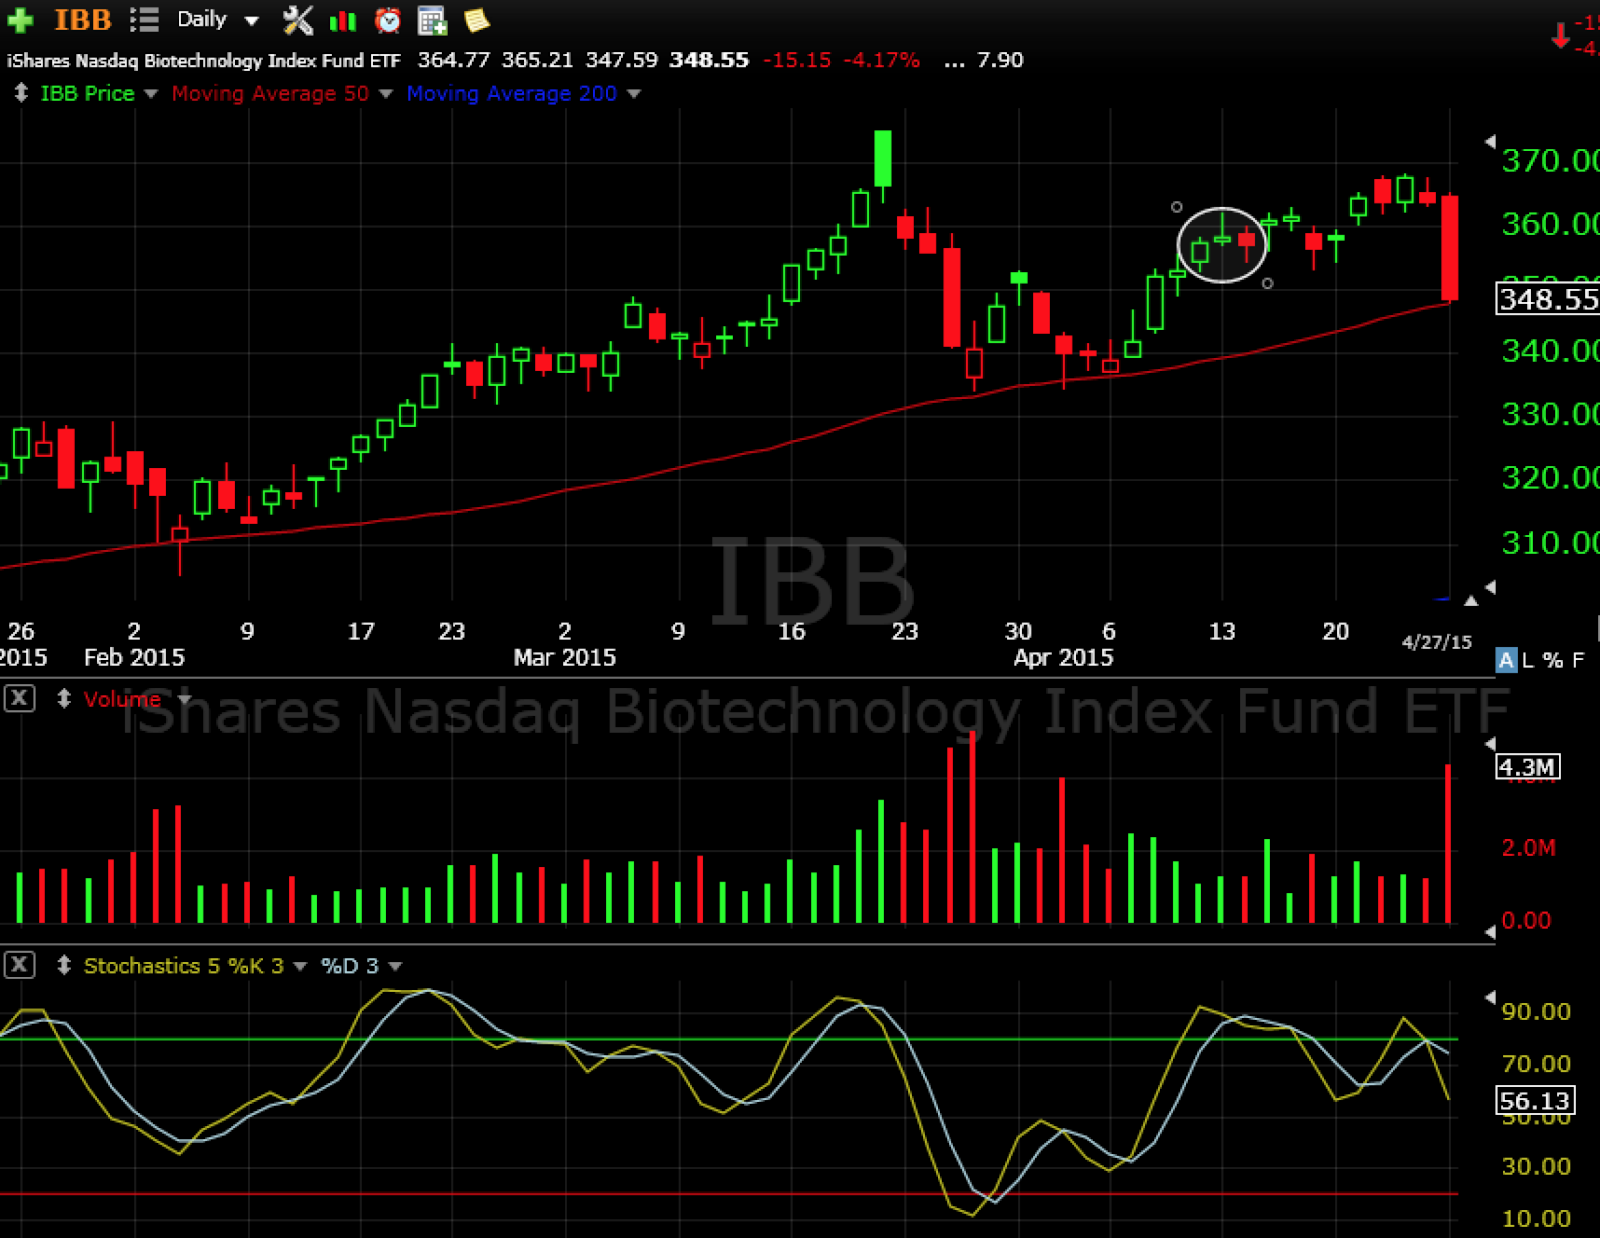
Today’s stock chart of the day is Biotechnology ETF IBB. The pulled back hard taking a number of hot biotech stocks down with it.
Subscribe to The Market Speculator by Email
The fact that IBB pulled back hard is a concern for the market since it has been leading the market.
However, the stock is sitting right at they key 50 day moving average level. This could lead to a small reflex bounce even if it does break the support level and start a downtrend. An entry here offers an easily manageable trade with low risk, high reward.
If taking a stab here, make sure to manage risk with a stop under the moving average and a target that gives you a 2:1 reward to risk ratio.
Please retweet if you liked this article! Tweet
P.S. If you like this article, share it, comment on it or let me know.

Leave a comment