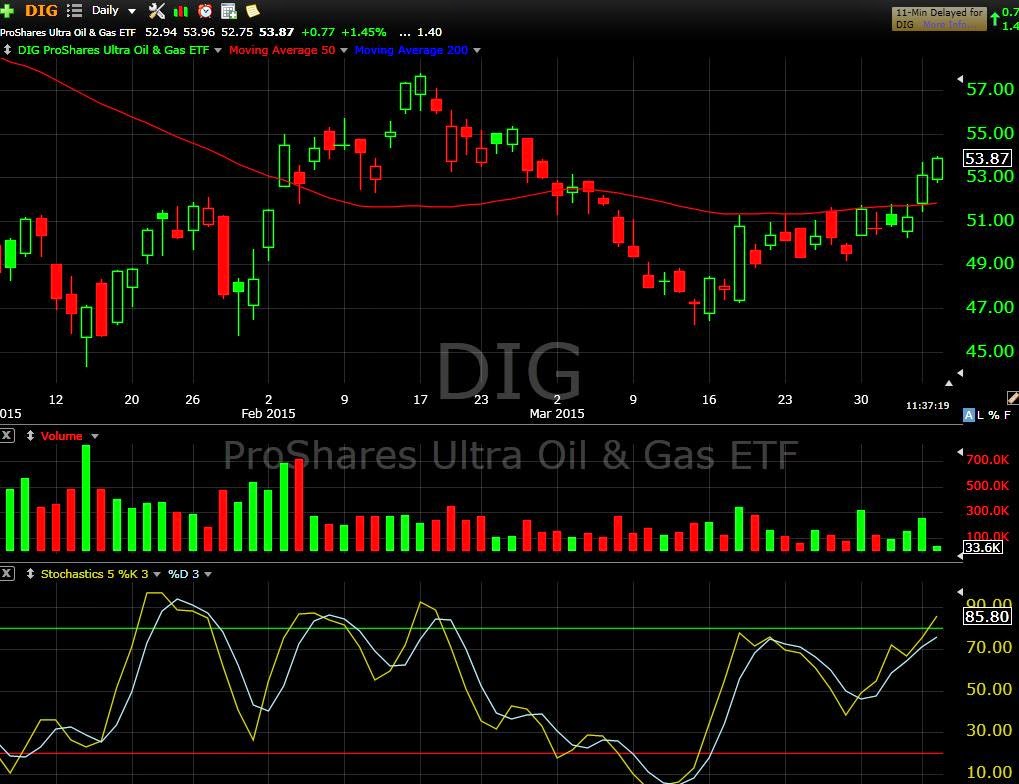
Today’s swing trade stock chart of the day is DIG. Energy is showing positive money flow and the sector has broke out over the 50 day moving average. Here we can place a stop under the moving average with a target at the recent February pivot high at $57.
Subscribe to The Market Speculator by Email
I will wait for a slight pullback from this level to attempt to get better value, though this is risky as the stock could move from here.
If you would like to learn more about how I trade, receive my nightly focus list with market analysis,setups and trade alerts, sign up for a 14 day free trial at BullsonWallStreet.com.
If you like this article, follow me on twitter
P.S. If you like this article, share it, comment on it or let me know.

Leave a comment