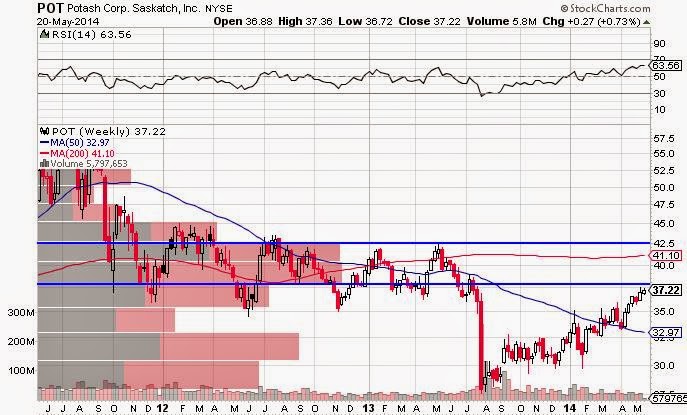
POT is heading into some major resistance levels, as it heads into a range that developed over two years. Why is this significant? There are longer term position traders who have been waiting for POT to bounce back up to their entry levels so they can avoid taking a loss. Expect these guys to sell when they have the chance.
It pays not only to see where support and resistance levels are, but to understand the pyschology behind those levels.
I have partnered with the guys at BullsonWallStreet.com. Sign up for a free 7 day trial of my nightly Trade Report, which has everything the swing and part-time trader needs to get ready for the coming trading day.

Leave a comment