Chart: BOOM

Published by

on

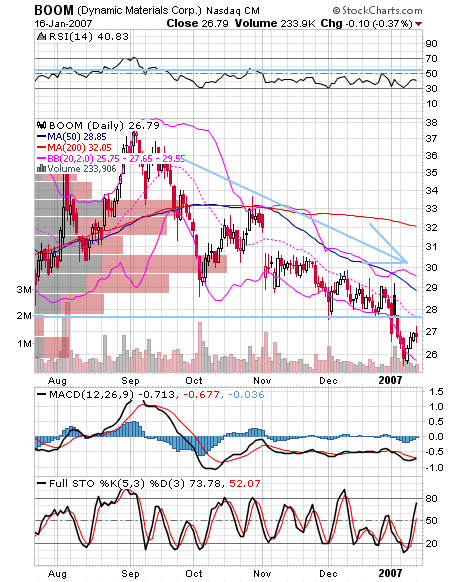
BOOM has had trouble handling the middle bollinger band (20 day moving average) and is bouncing towards that level. RSI and price also provide resistance areas that will need to be mounted before reversing the downtrend.

update: sorry for not pointing out that this is a short setup (as long as it stays under $28).

3 responses to “Chart: BOOM”

  1. Anonymous Avatar
    Anonymous

    BOOM stock does not look good at all…has huge overhead resistance and it is below its 50/200 day moving averages. Best to step aside.

    Like

  2. The Market Speculator Avatar

    My bad for not pointing out BOOM is a short setup.

    Like

  3. Anonymous Avatar
    Anonymous

    BOOM – short setup, yes.Just need it to fail at its retest of the 50dma.All the big winners of the past usually make great shorts.< HREF="http://www.investorsparadise.com/marketspeculator" REL="nofollow">Market Speculator<>

    Like

Leave a reply to The Market Speculator Cancel reply

Previous Post
Next Post