Chart: AKAM

Published by

on

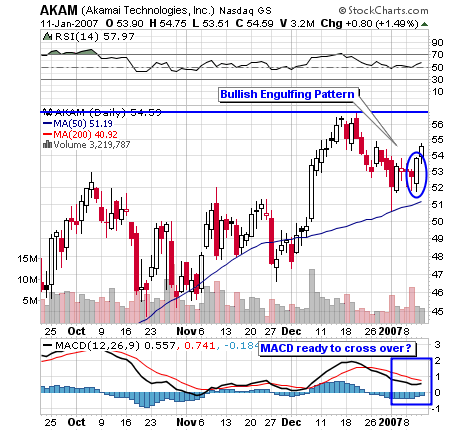
AKAM (Alkamai Technologies, Inc.) has been on my bearish list of late, but things have changed since the stock followed through today off a bullish englulfing candle pattern. Also note that the MACD looks ready to turn positive. Things will get interesting if the stock can clear recent highs on decent sized volume.

3 responses to “Chart: AKAM”

  1. walter Avatar

    ugly candle from AKAM today – distribution? volume just ok…was rejected at long term up trendlinewill be watching on tuesday for weakess/short entry

    Like

  2. walter Avatar

    how do you like SPG for RSI negative divergence?REIT stocks in general are very toppy

    Like

  3. The Market Speculator Avatar

    Walter,Yes, negative divergence at highs and a high volume day of indecision leads me to believe the stock may top out, at least in the very short term. However, I would wait for confirmation before entry (breakdown below old high)–that’s my style, altough you may be more aggressive than I. I know I entered early on the GROW trade, but there were more negative clues with GROW. For example, MACD was also negative, whereas SPG has a positive MACD reading.

    Like

Leave a reply to The Market Speculator Cancel reply

Previous Post
Next Post