Trades, Volume Spread Analysis, NVDA and STP

Published by

on

Yesterday I went short 600 shares STP (Suntech Power Holdings Co.) at $25.77. The bearish engulfing pattern worked out great, so I sold 300 shares at $24.75 for a $300 gain (+4.1%). I’m still short 300 shares, although the stock is showing a little strength this morning.

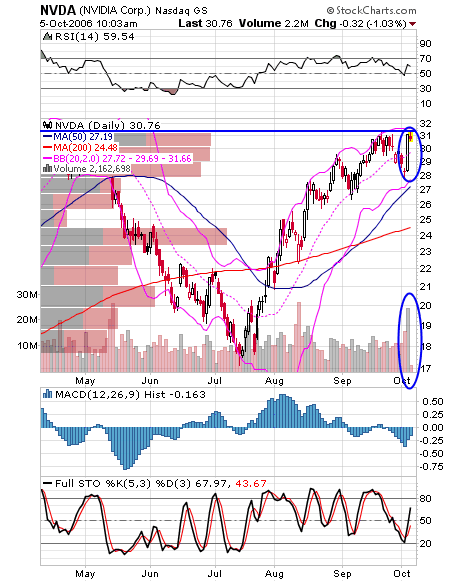
According to Volume Spread Analysis, a long bullish looking bar bumping into resistance on abnormally high volume is a good shorting opportunity. This chart of NVDA (NVIDIA Corp.) is a perfect setup. I went short 300 shares and have a stop placed just above resistance.

8 responses to “Trades, Volume Spread Analysis, NVDA and STP”

  1. walter Avatar

    BA pulled the same thing…Good job with the charts!

    Like

  2. walter Avatar

    I think MON is setting up to be a great short – topping red flags there…I’m curious to know your thoughts…Thanks!

    Like

  3. walter Avatar

    same goes for BAM and COF

    Like

  4. walter Avatar

    WMT pulled one also

    Like

  5. walter Avatar

    bullish or bearish HARAMI on SNDK?

    Like

  6. The Market Speculator Avatar

    The only stock that you mentioned that’s on my current watchlist is SNDK. I can’t take a bullish or bearish position until it crosses a significant S/R. If it breaks the 200 day MA and pushes past 60, I’d be bullish. If it falters at these levels, I think it’s in for a nose dive and I’ll be ready to short.I also pay attention to BA and WMT, but don’t trade them.

    Like

  7. The Market Speculator Avatar

    Walter,You asked about the “harami”. While I am a proponent of candlesticks, I think they are best used at important points (S/R, MA, etc). The formation you pointed to is in “mo man’s land”, so it’s not as relevant for *my* purposes. Others, like yourself, may have a great strategy that works at other levels, but I don’t.Best!

    Like

  8. walter Avatar

    regarding candlesticks, i have read that… i am relatively new to them and am excited about that because i think that you can read a lot from the price/volume mechanics of a stock on daily basis… that being said, i was using those open/close bars before but now use candles…otherwise, i prefer trenline analysis (aka Tim Knight) and will turn to indicators, when close to support/resistance, TLs, etcthanks

    Like

Leave a reply to walter Cancel reply